CROFT
Client
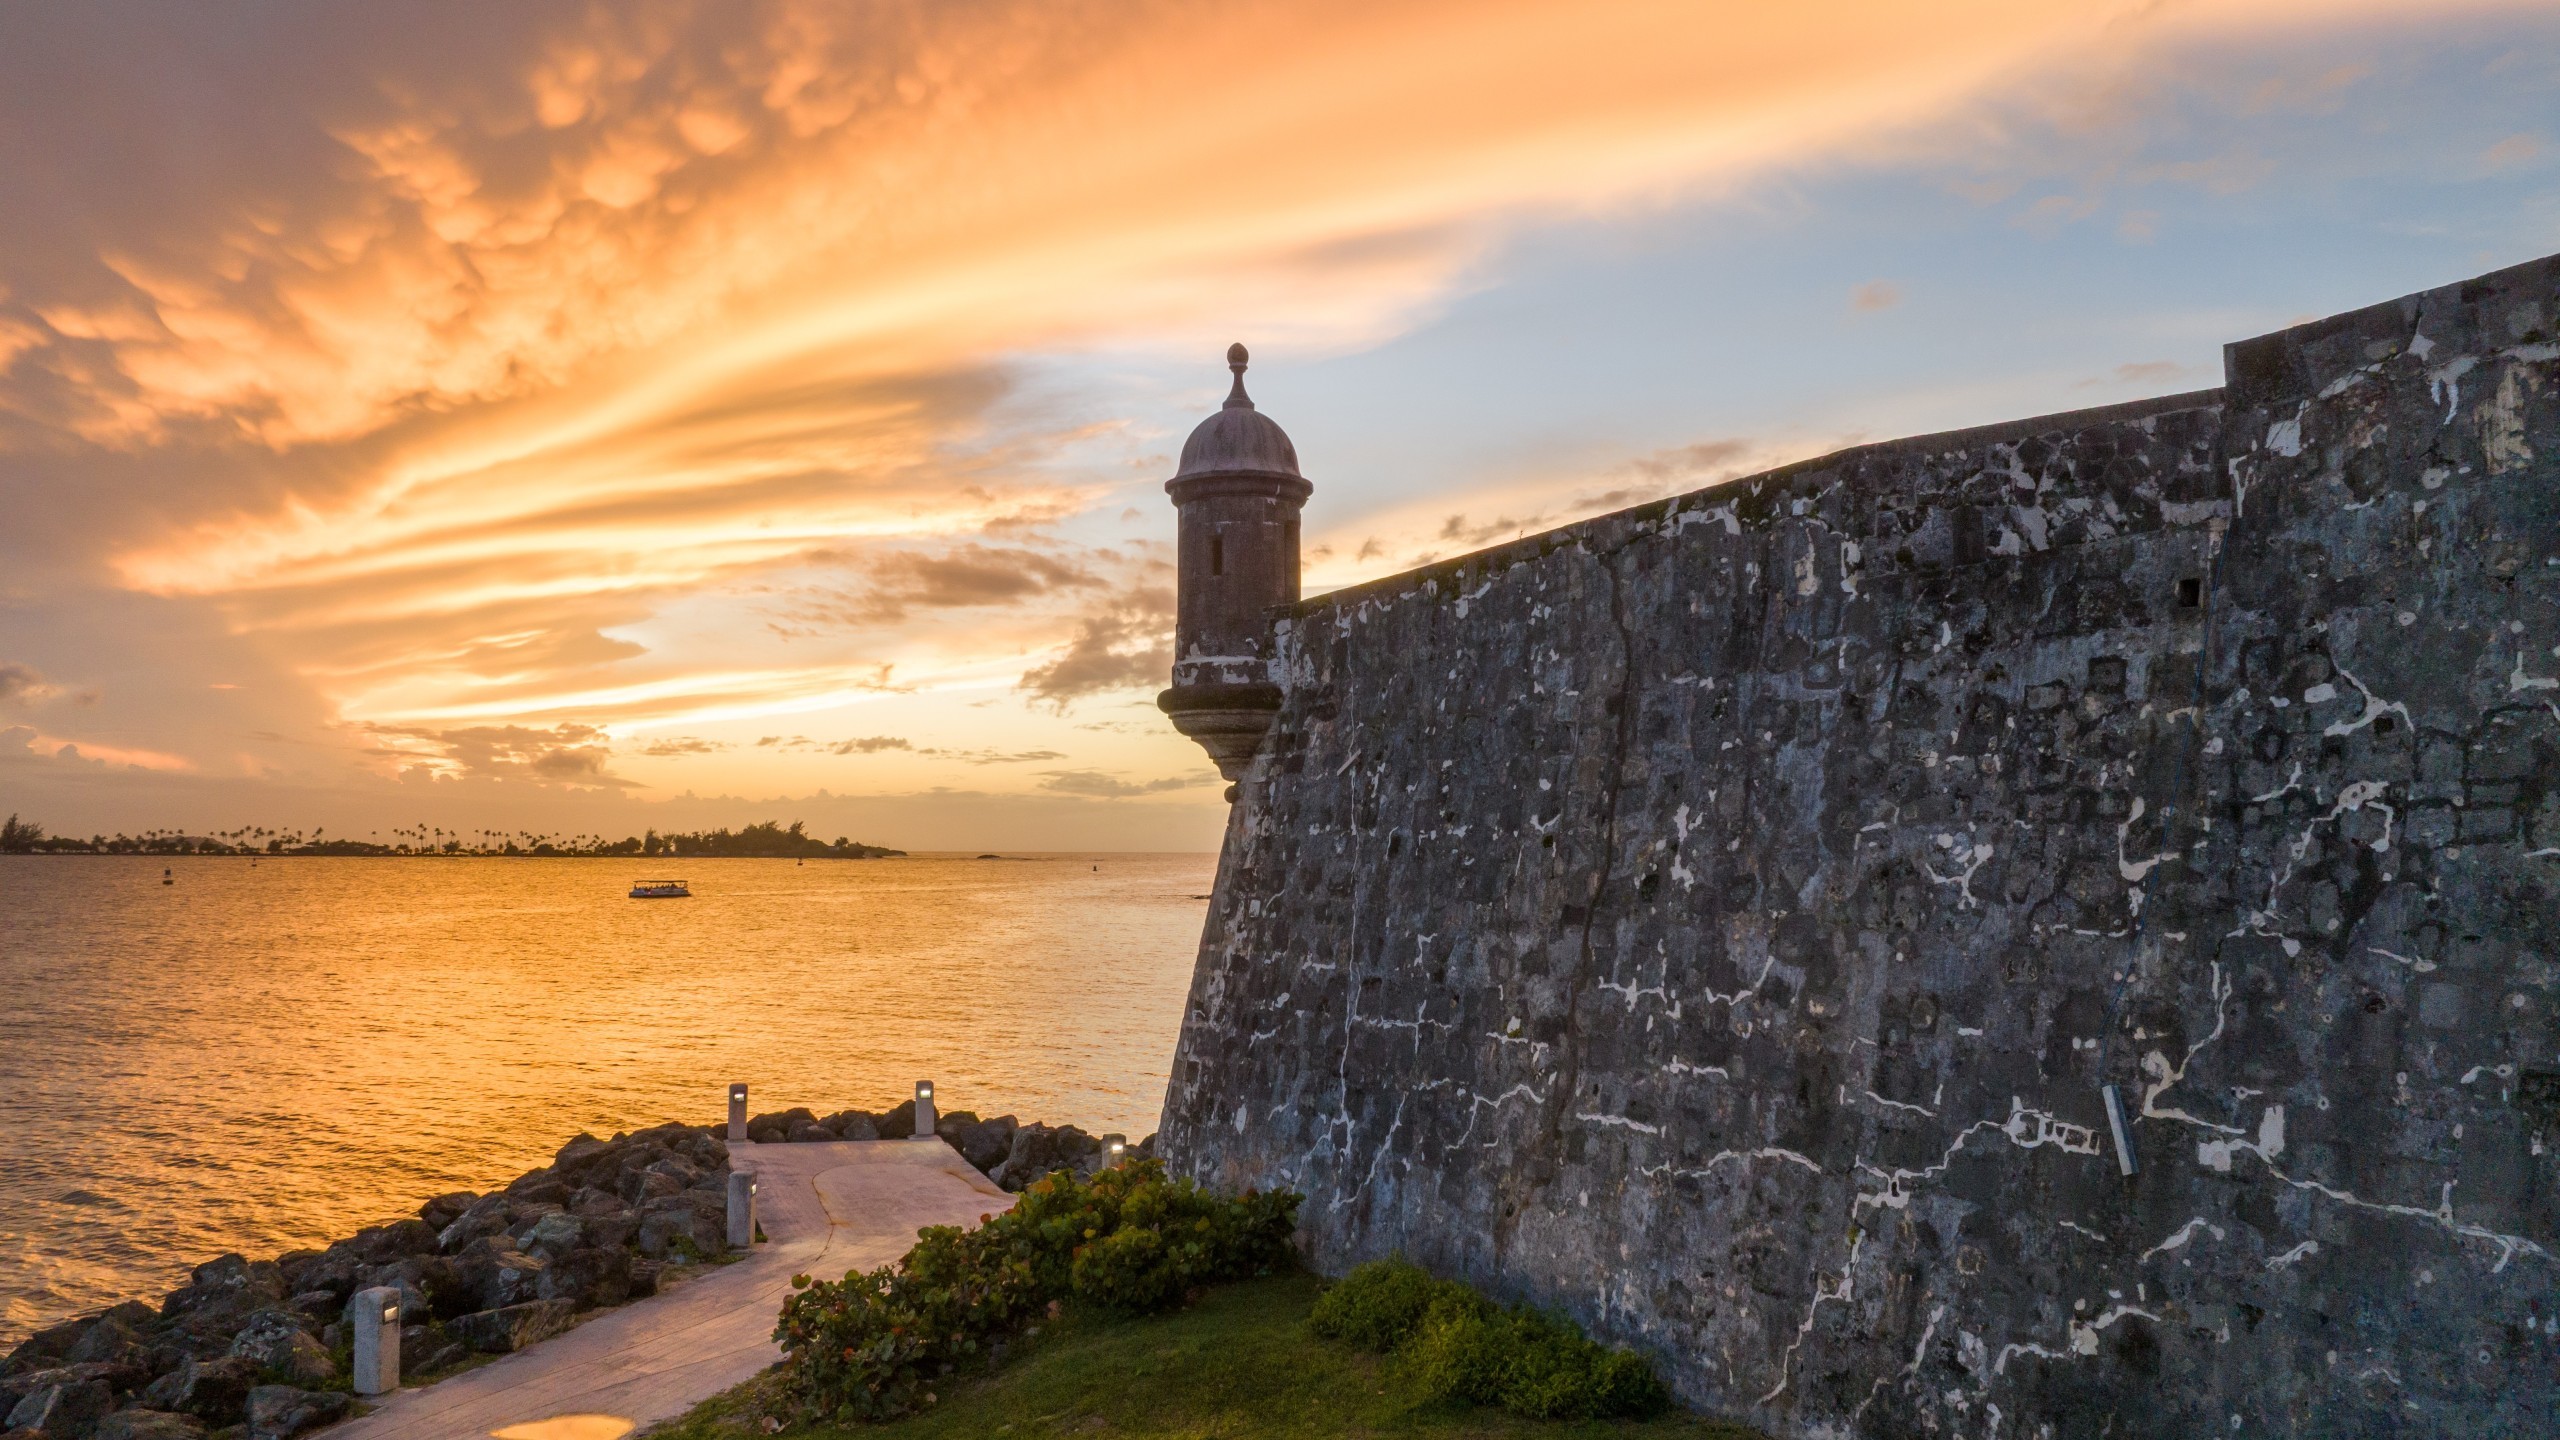
St. Augustine, FL
Location
1695
Year Built
Documenting 1,355 linear feet of historic seawall at the Castillo de San Marcos meant working around tides, unstable riverbed, and wall surfaces normally submerged and only exposed for a few hours on the lowest tide days of the year. When CROFT needed accurate existing conditions documentation to support the NPS seawall rehabilitation project, RC Monkeys delivered a comprehensive as-built dataset covering 100% of the scope area, giving the design team the accuracy and visual detail needed for condition assessment and seawall repair planning.
[ SERVICES ]
Laser Scanning
3D Virtual Tour
Photogrammetry
[ delivered value ]
Reliable existing conditions for seawall rehabilitation
Single source of truth, combining geometrical accuracy and visual detail
Every linear foot documented, including surfaces normally submerged
Remote access to wall conditions, reducing repeat site visits


[ challenge ]
Decades of exposure to storms, erosion, and sea level rise had left the seawall system in fair to poor condition, with subsiding sections, material degradation, and increasing flood risk to the monument and surrounding city. The seawall includes five sections built at different times with different materials, each requiring a different rehabilitation approach. Portions of the wall could only be accessed during a limited low tide window, and the temporarily exposed riverbed was not stable enough for foot access, making conventional field documentation impractical for the full scope.
[ SOLUTION ]
The capture strategy had to work around the tide, not against it.
Terrestrial laser scanning from accessible positions was combined with aerial photography to capture normally submerged wall surfaces during the brief low-tide exposure window, producing a complete 3D photogrammetry model and point cloud for the full 1,355-foot scope area.
A web-hosted mesh model, georeferenced source photos, and a 3D virtual tour gave the team remote access to seawall conditions and tied defect observations directly to location-based visual documentation, making condition reporting more efficient.
The full dataset was delivered in 8 days, including travel and capture.
Explore Photogrammetry Model
Next